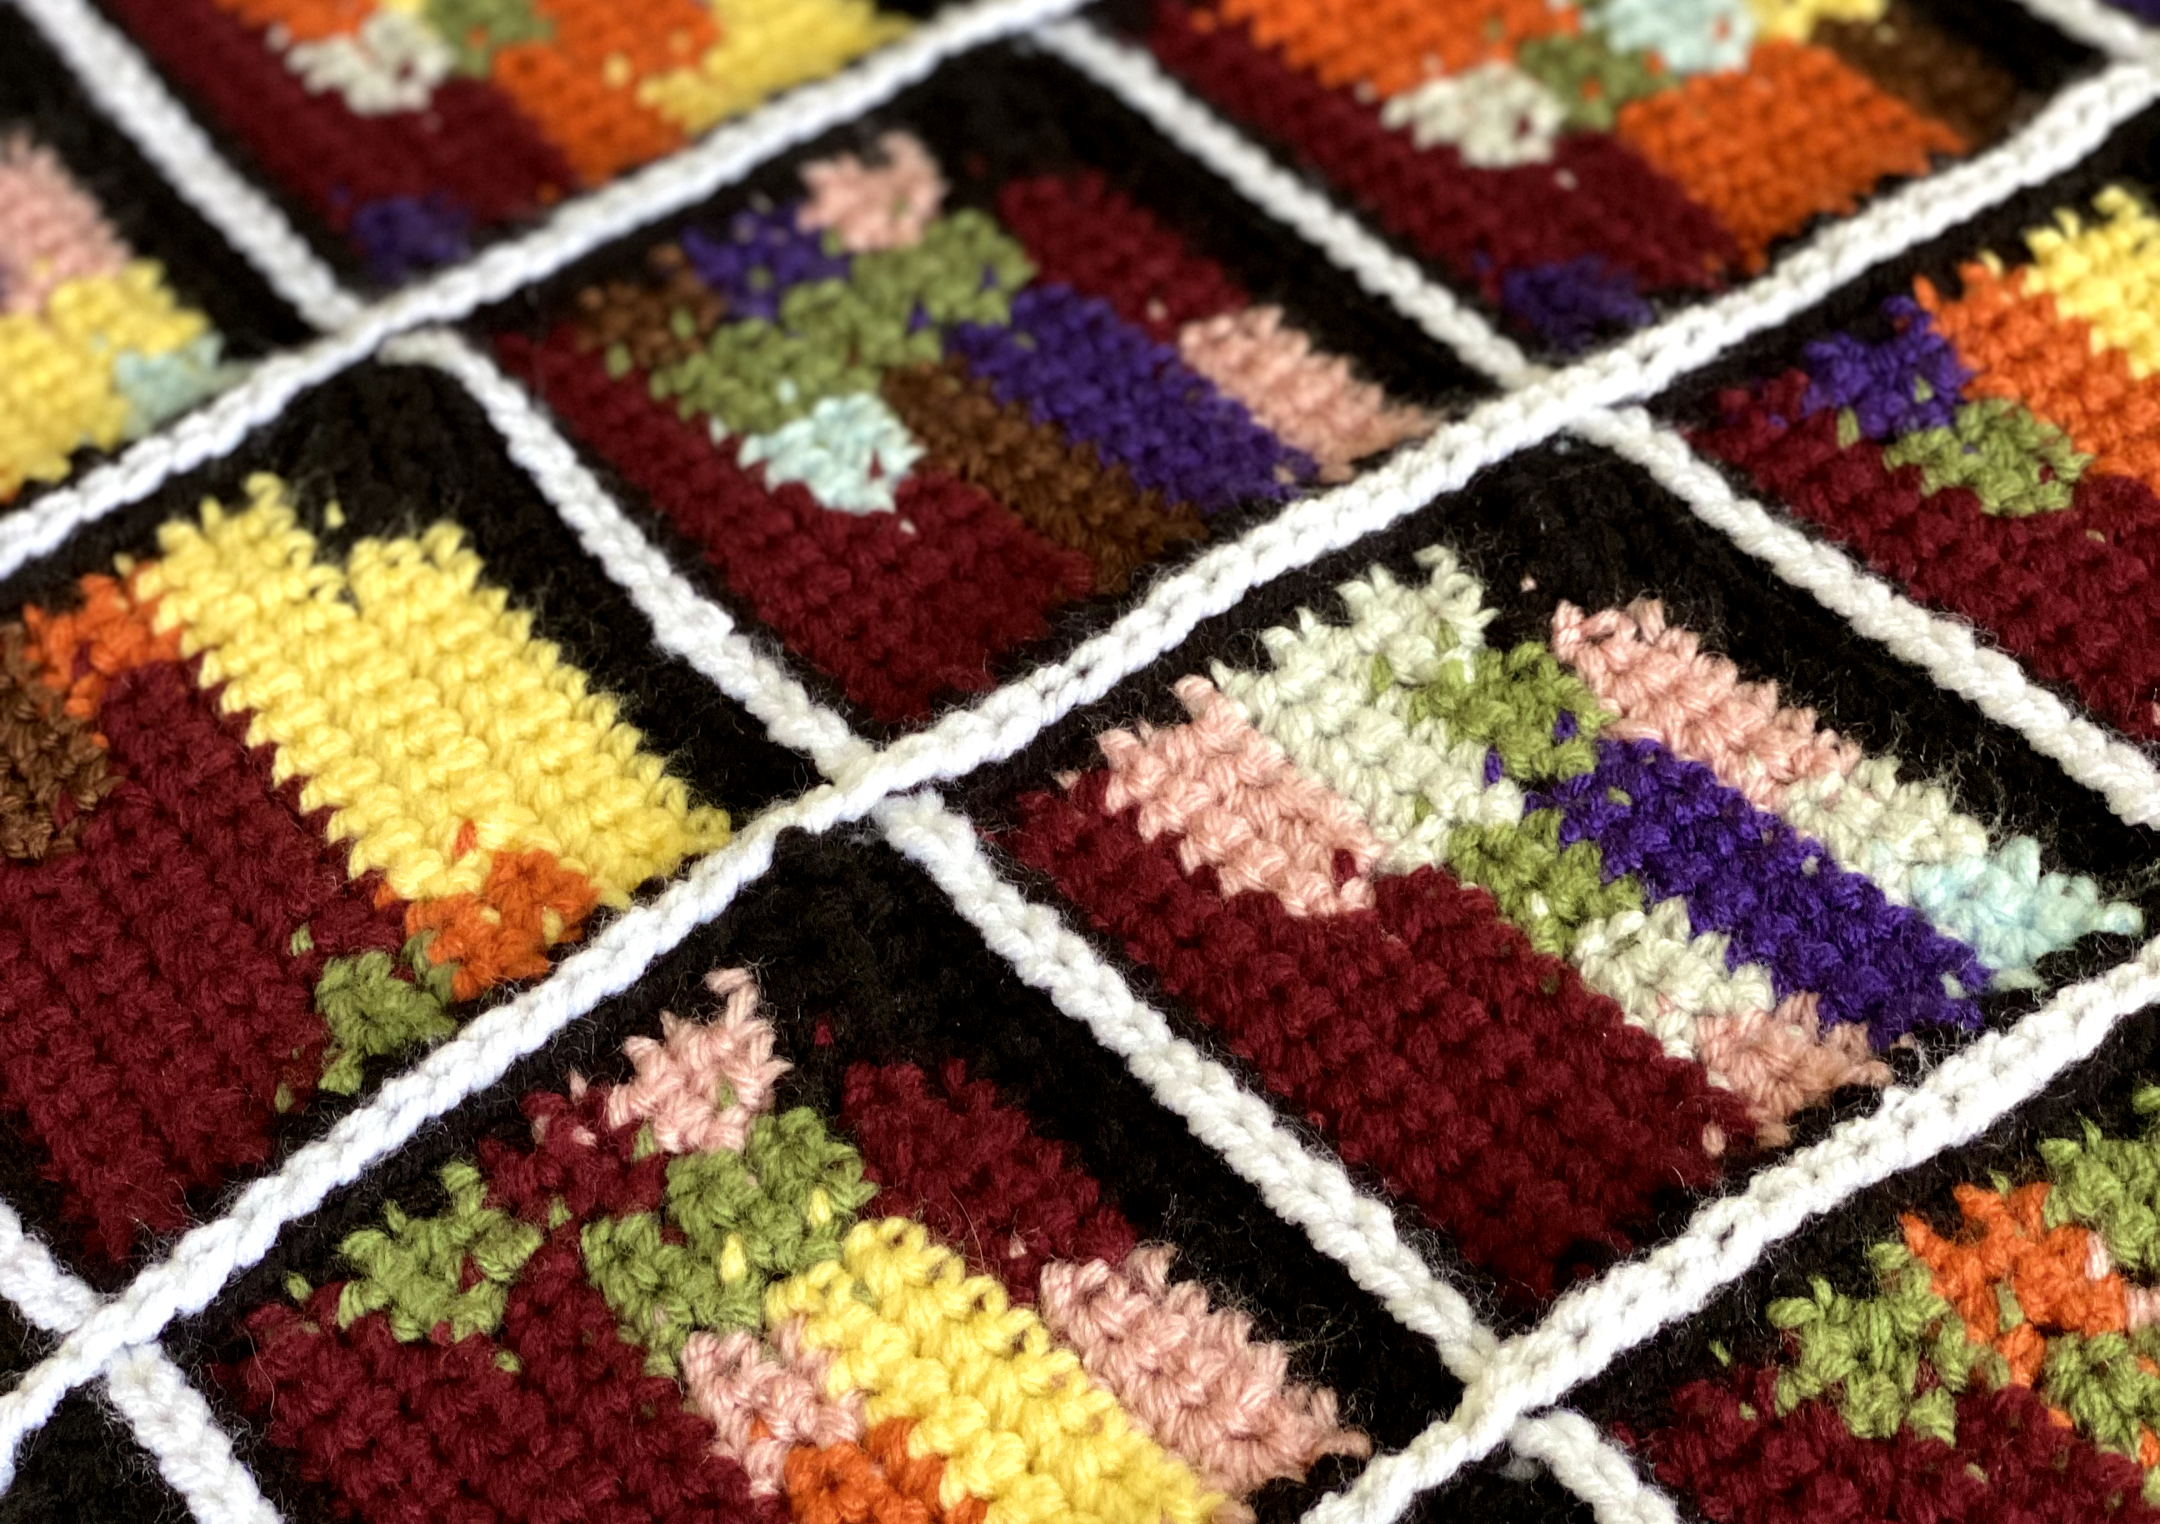
How We Spend Our Days is a collaborative data visualization project that documents how people choose to spend their time. Based on the Annie Dillard quote “How we spend our days is how we spend our lives,” the project intends to uncover similarities, differences, and patterns in the activities we tend to prioritize.
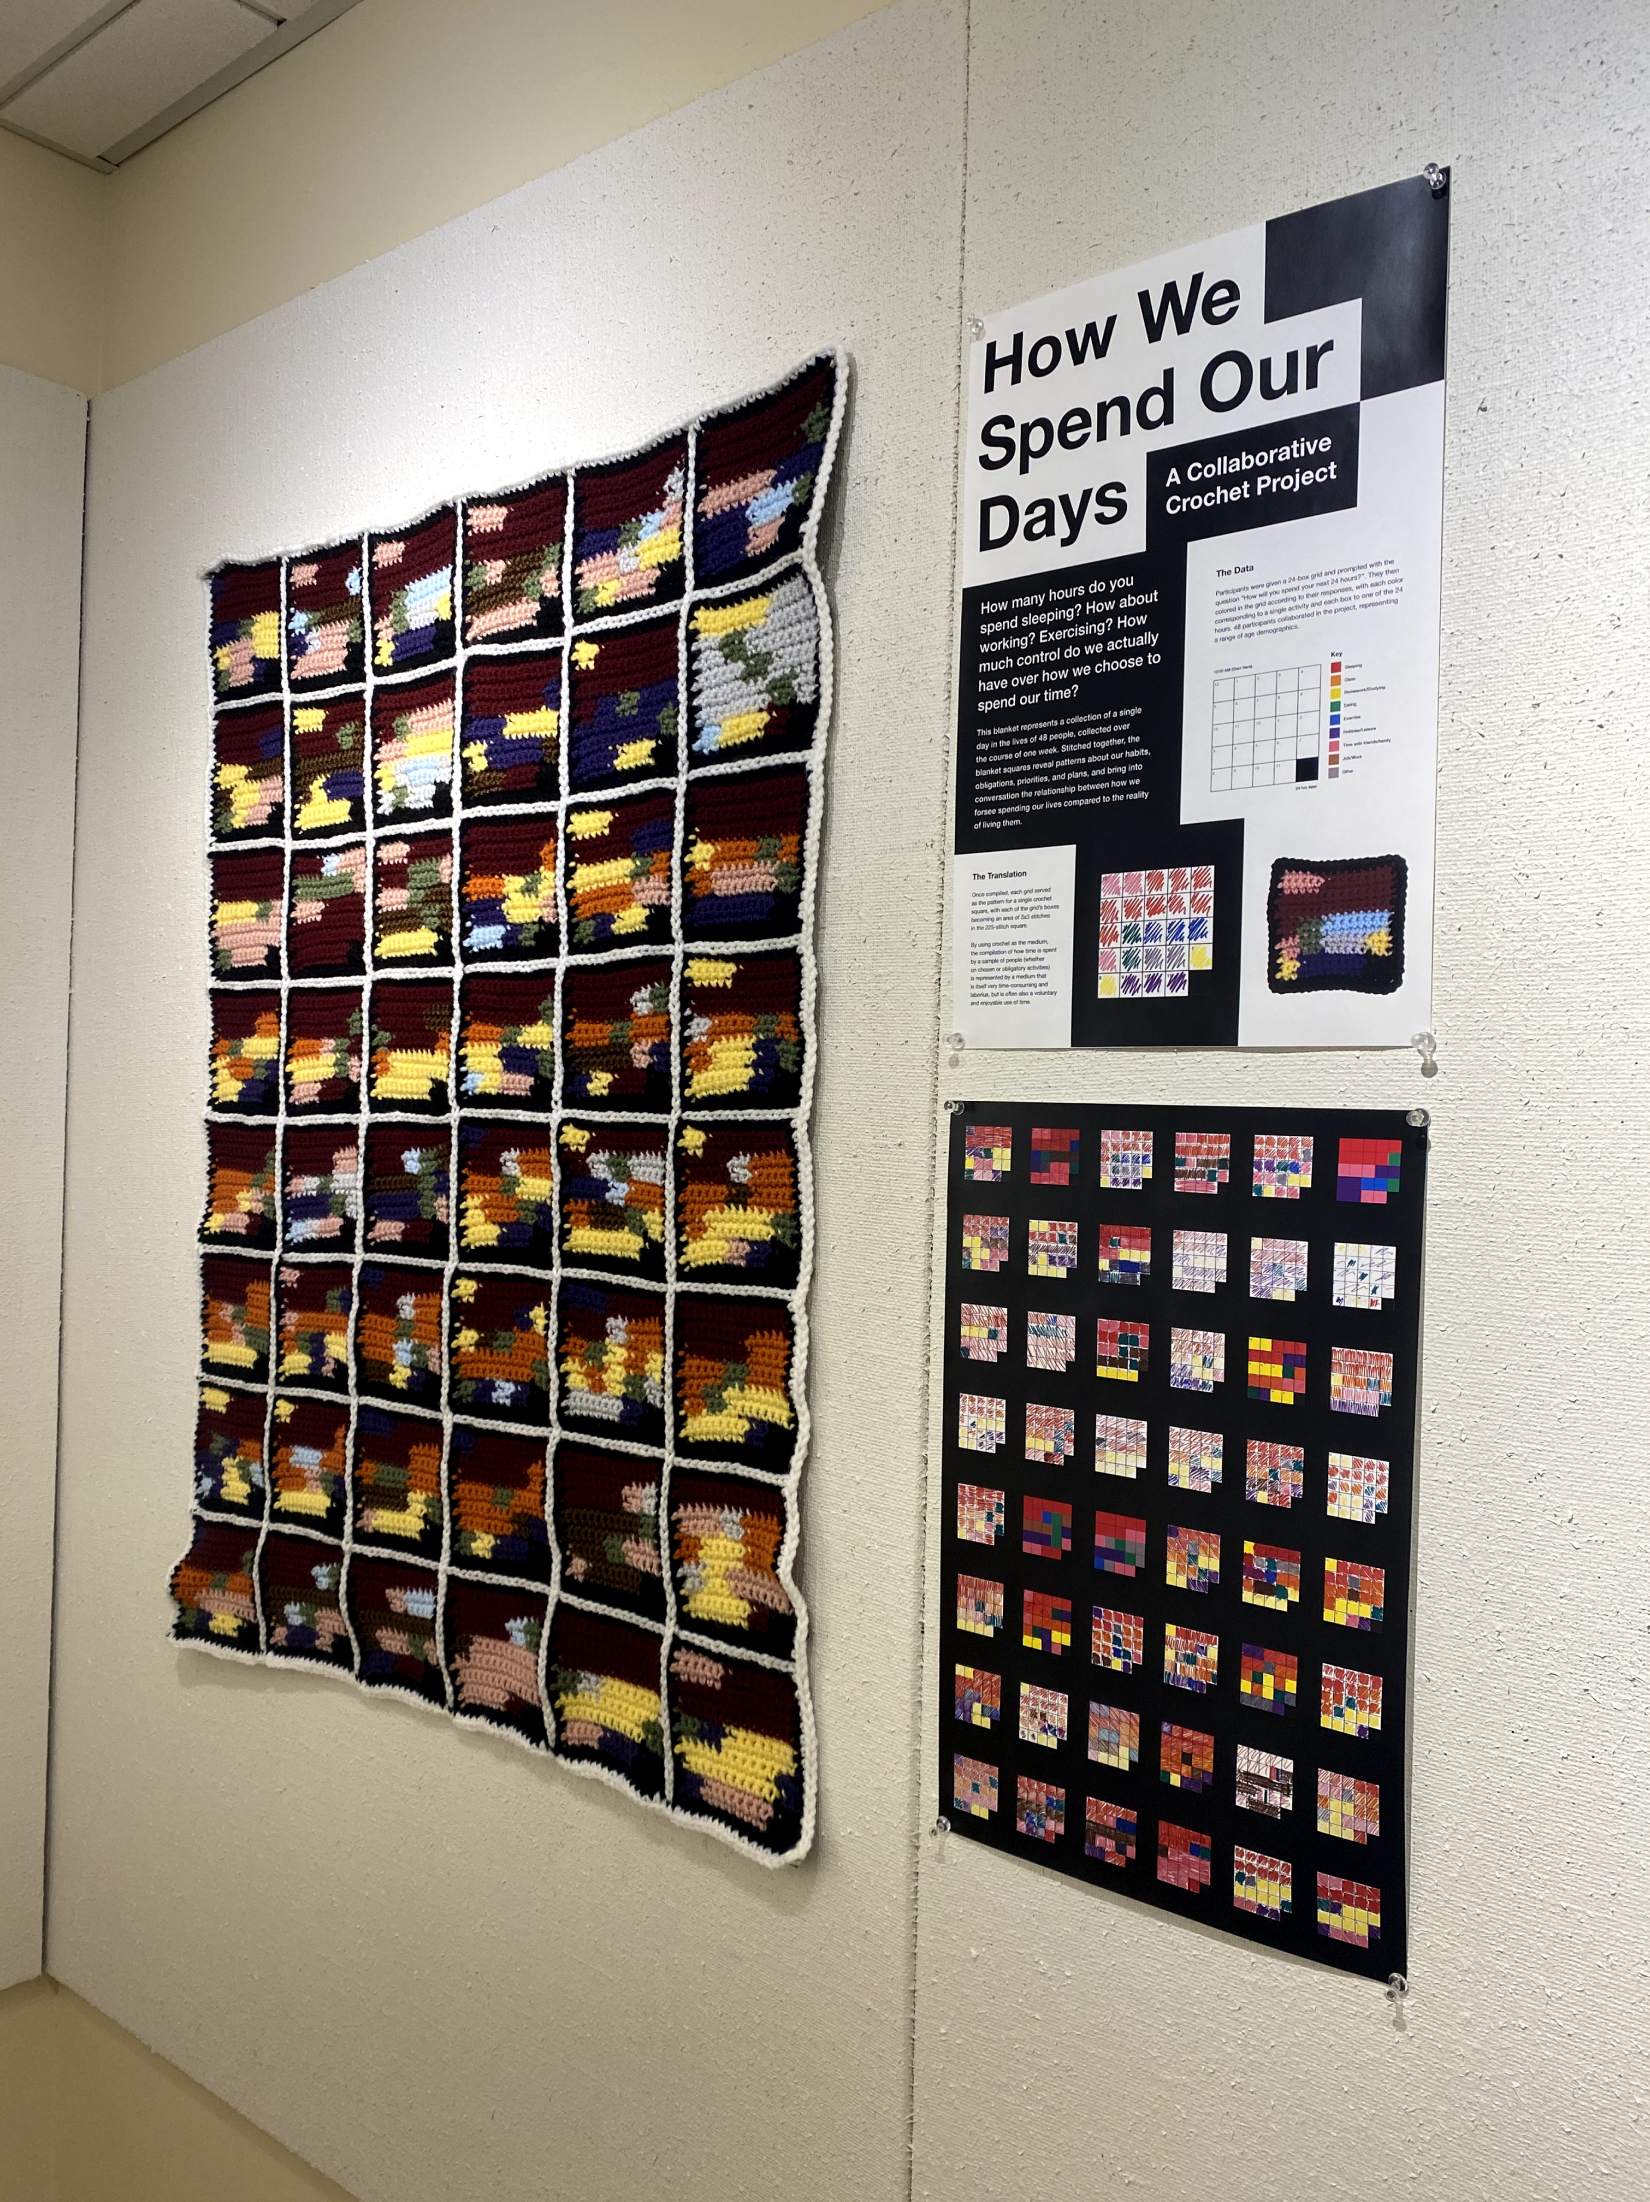
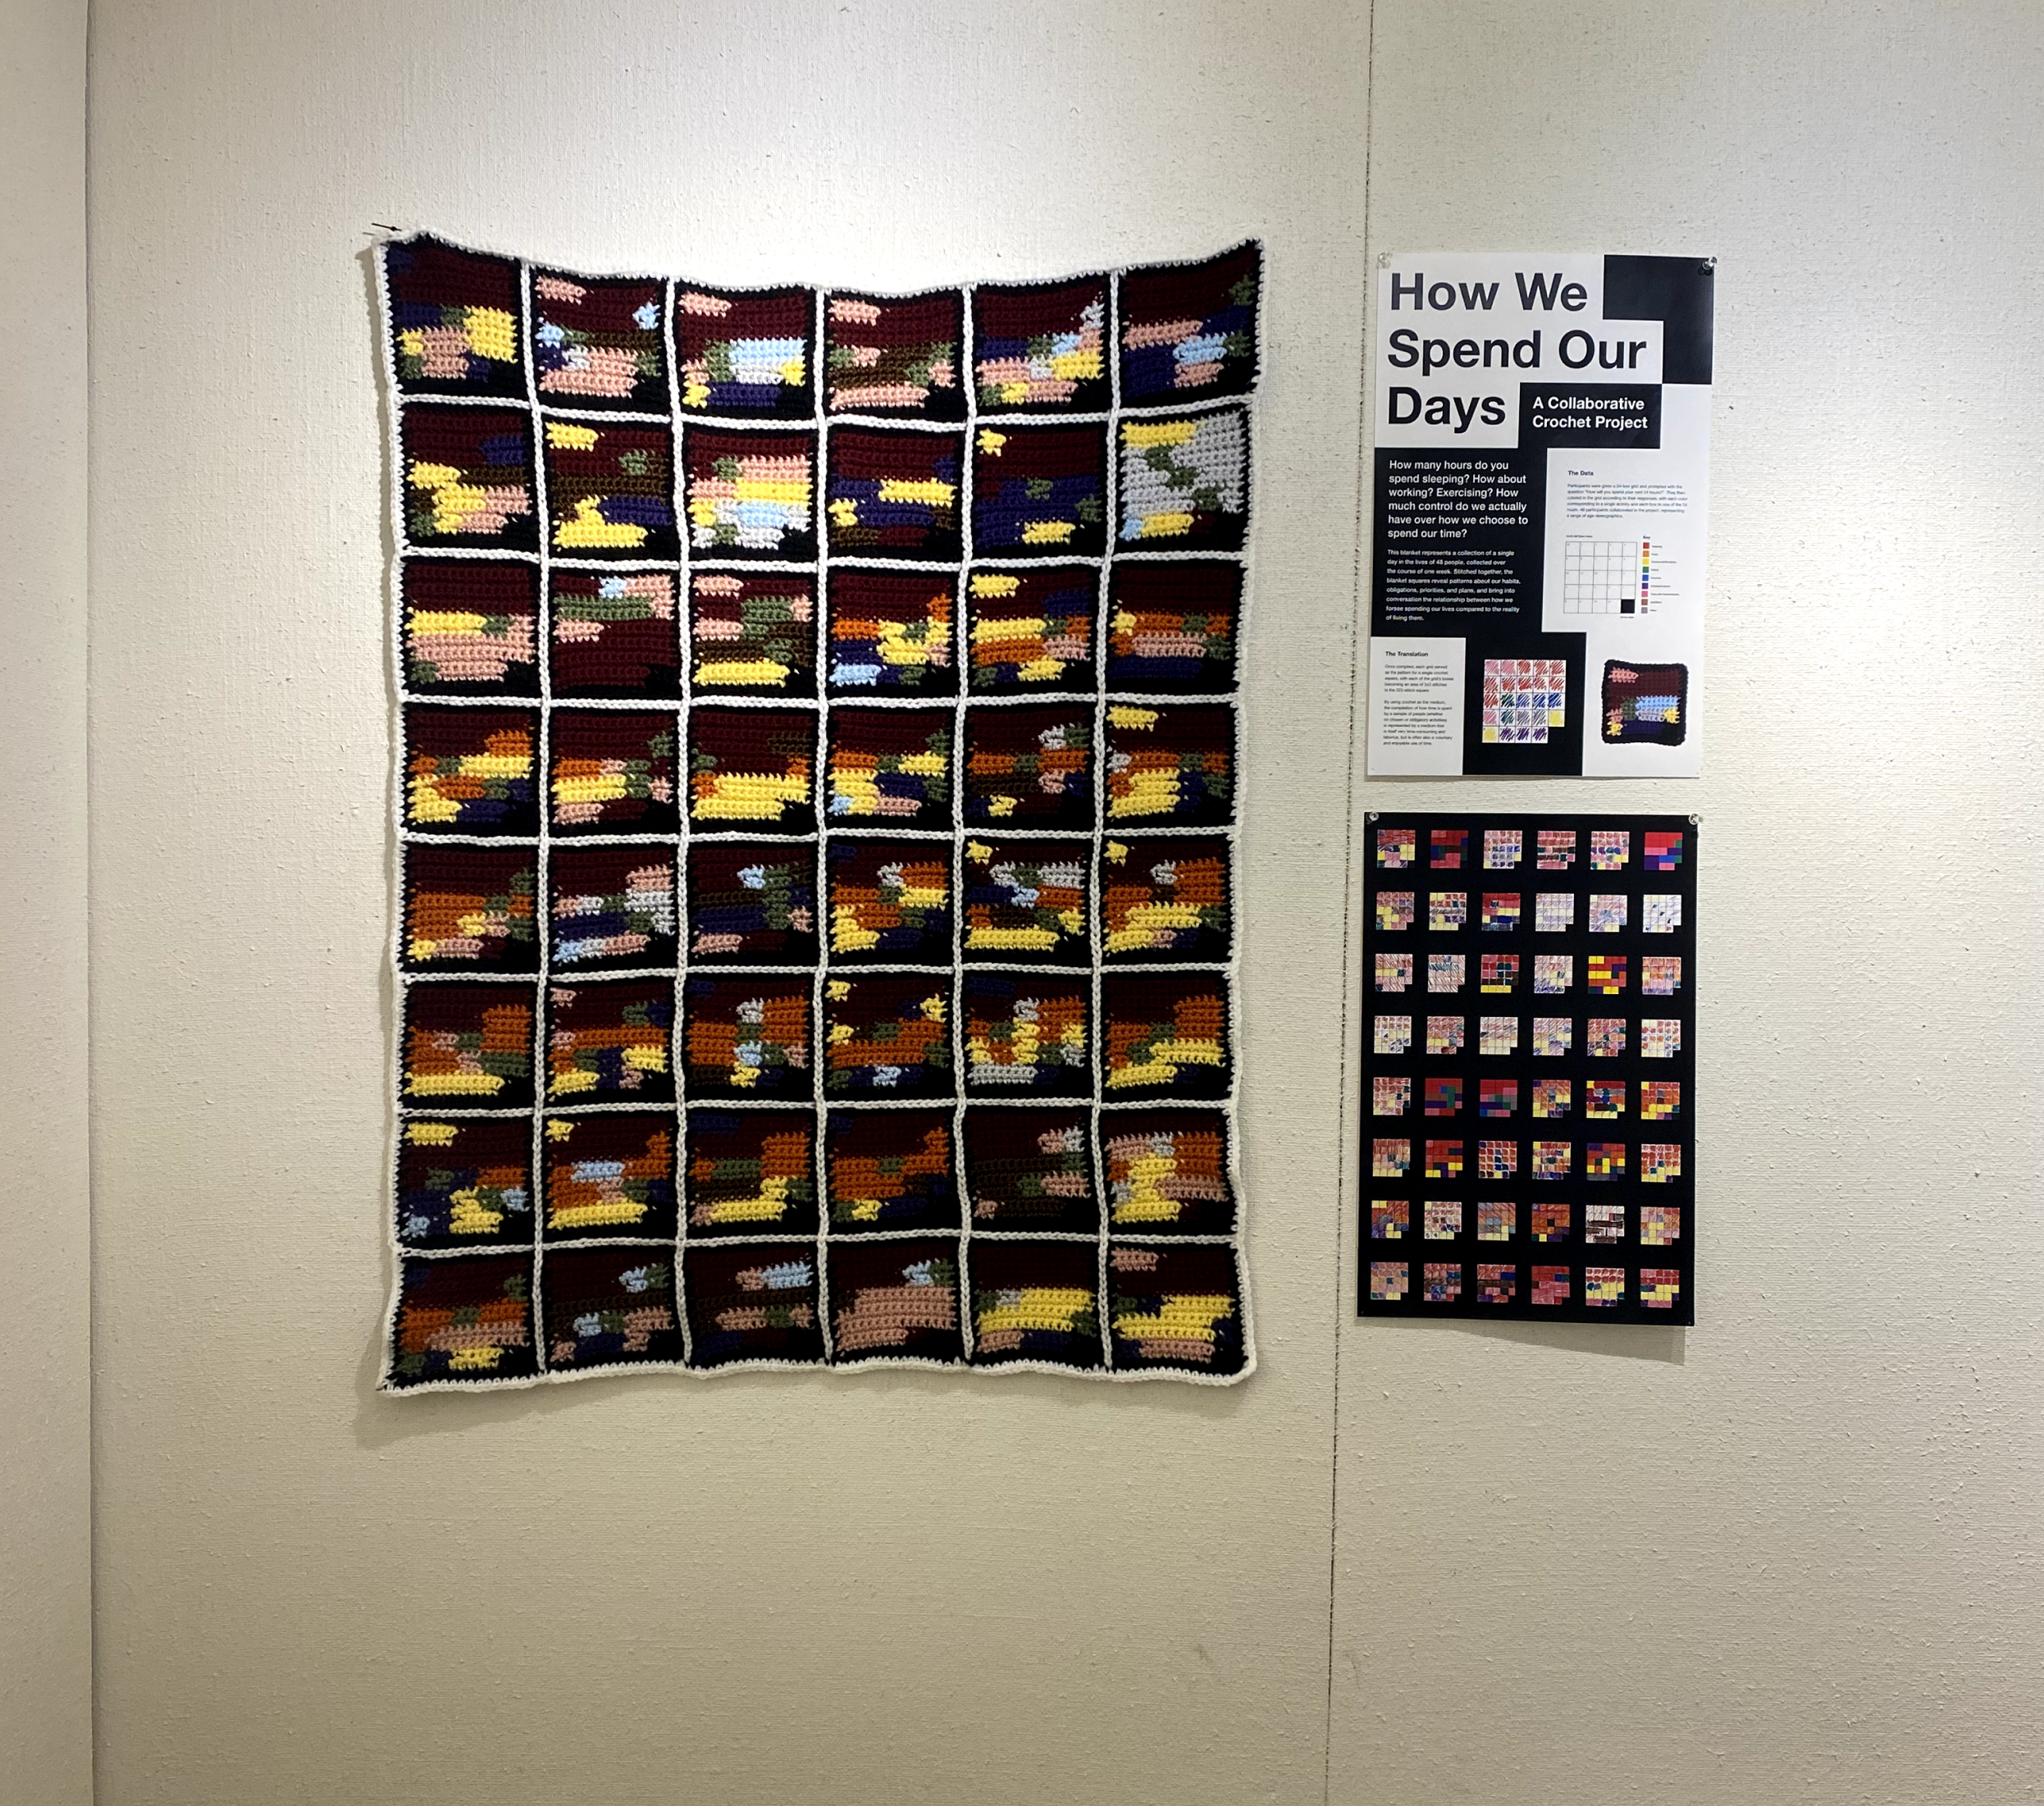
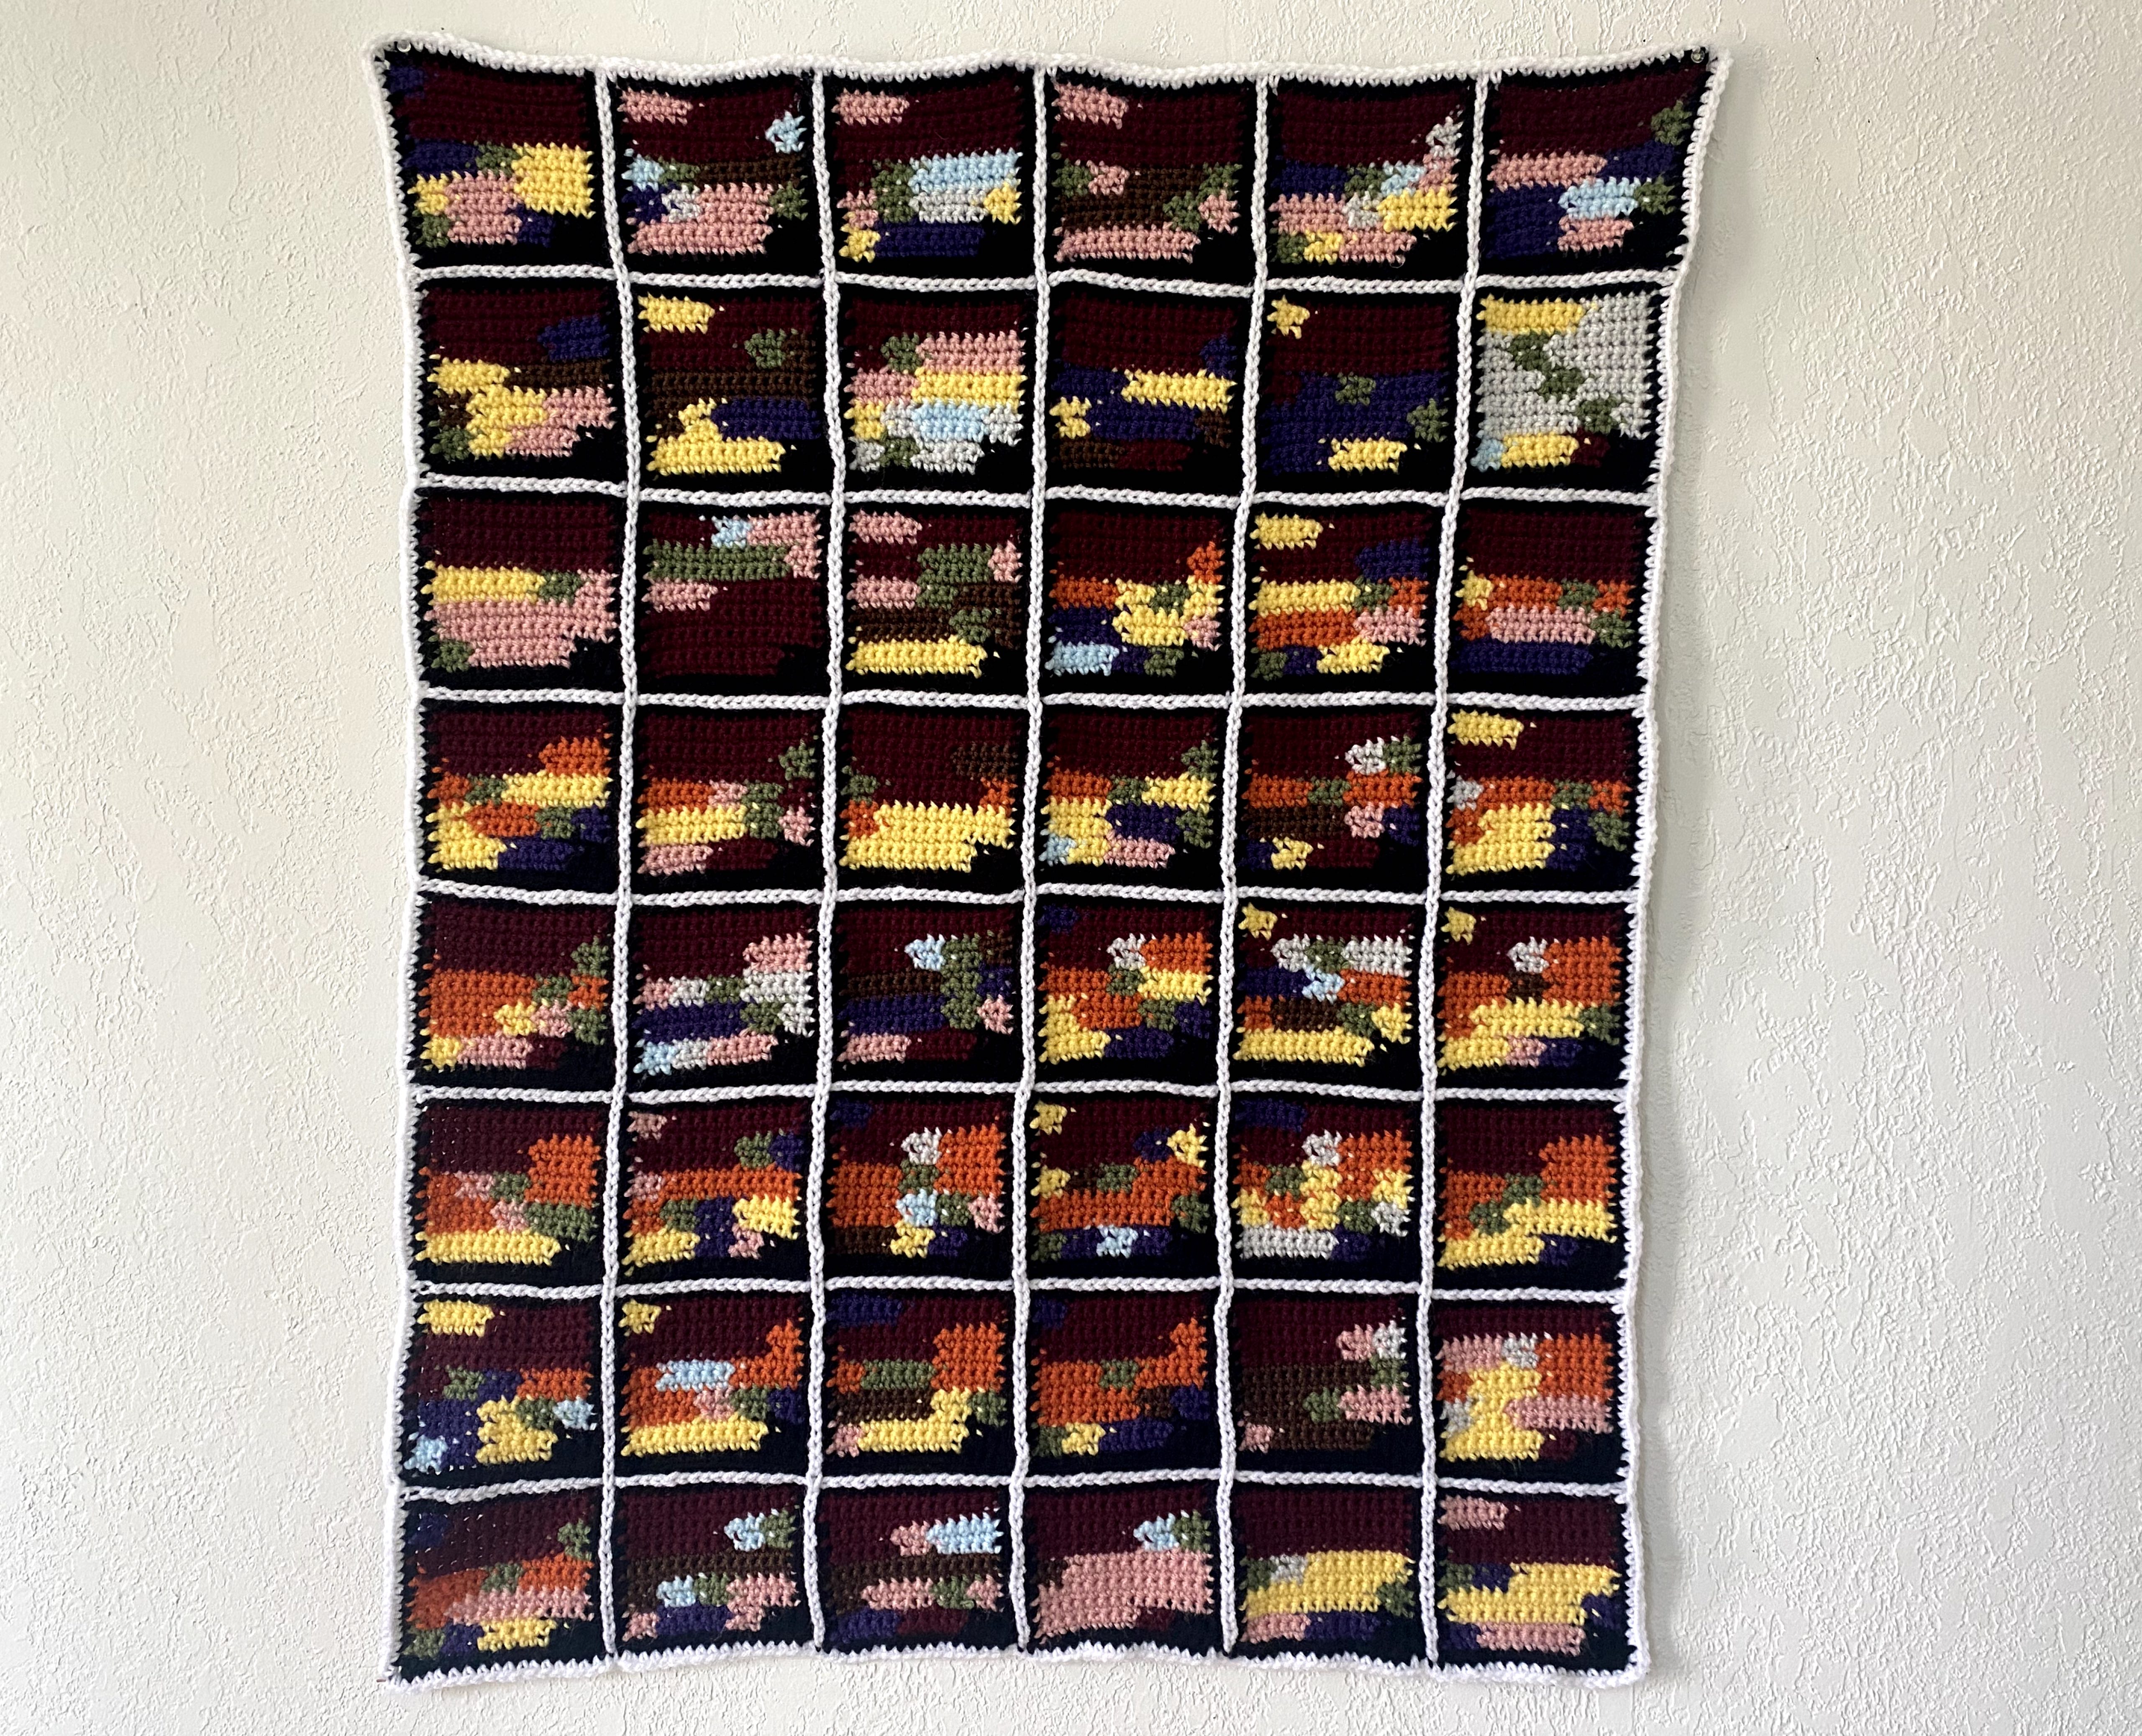
The crochet blanket consists of 48 squares, each representing a day in the life of 48 people. The square tracks the day’s 24 hours from midnight to midnight, beginning in the top left corner and ending in the bottom right, with each color representing a different use of time.
The medium of crochet carries a lot of weight in the communication of this particular data set. As an activity that is time consuming and laborious but also functions as an enjoyable pastime, it mirrors the balance of obligatory and chosen activities represented throughout the data.
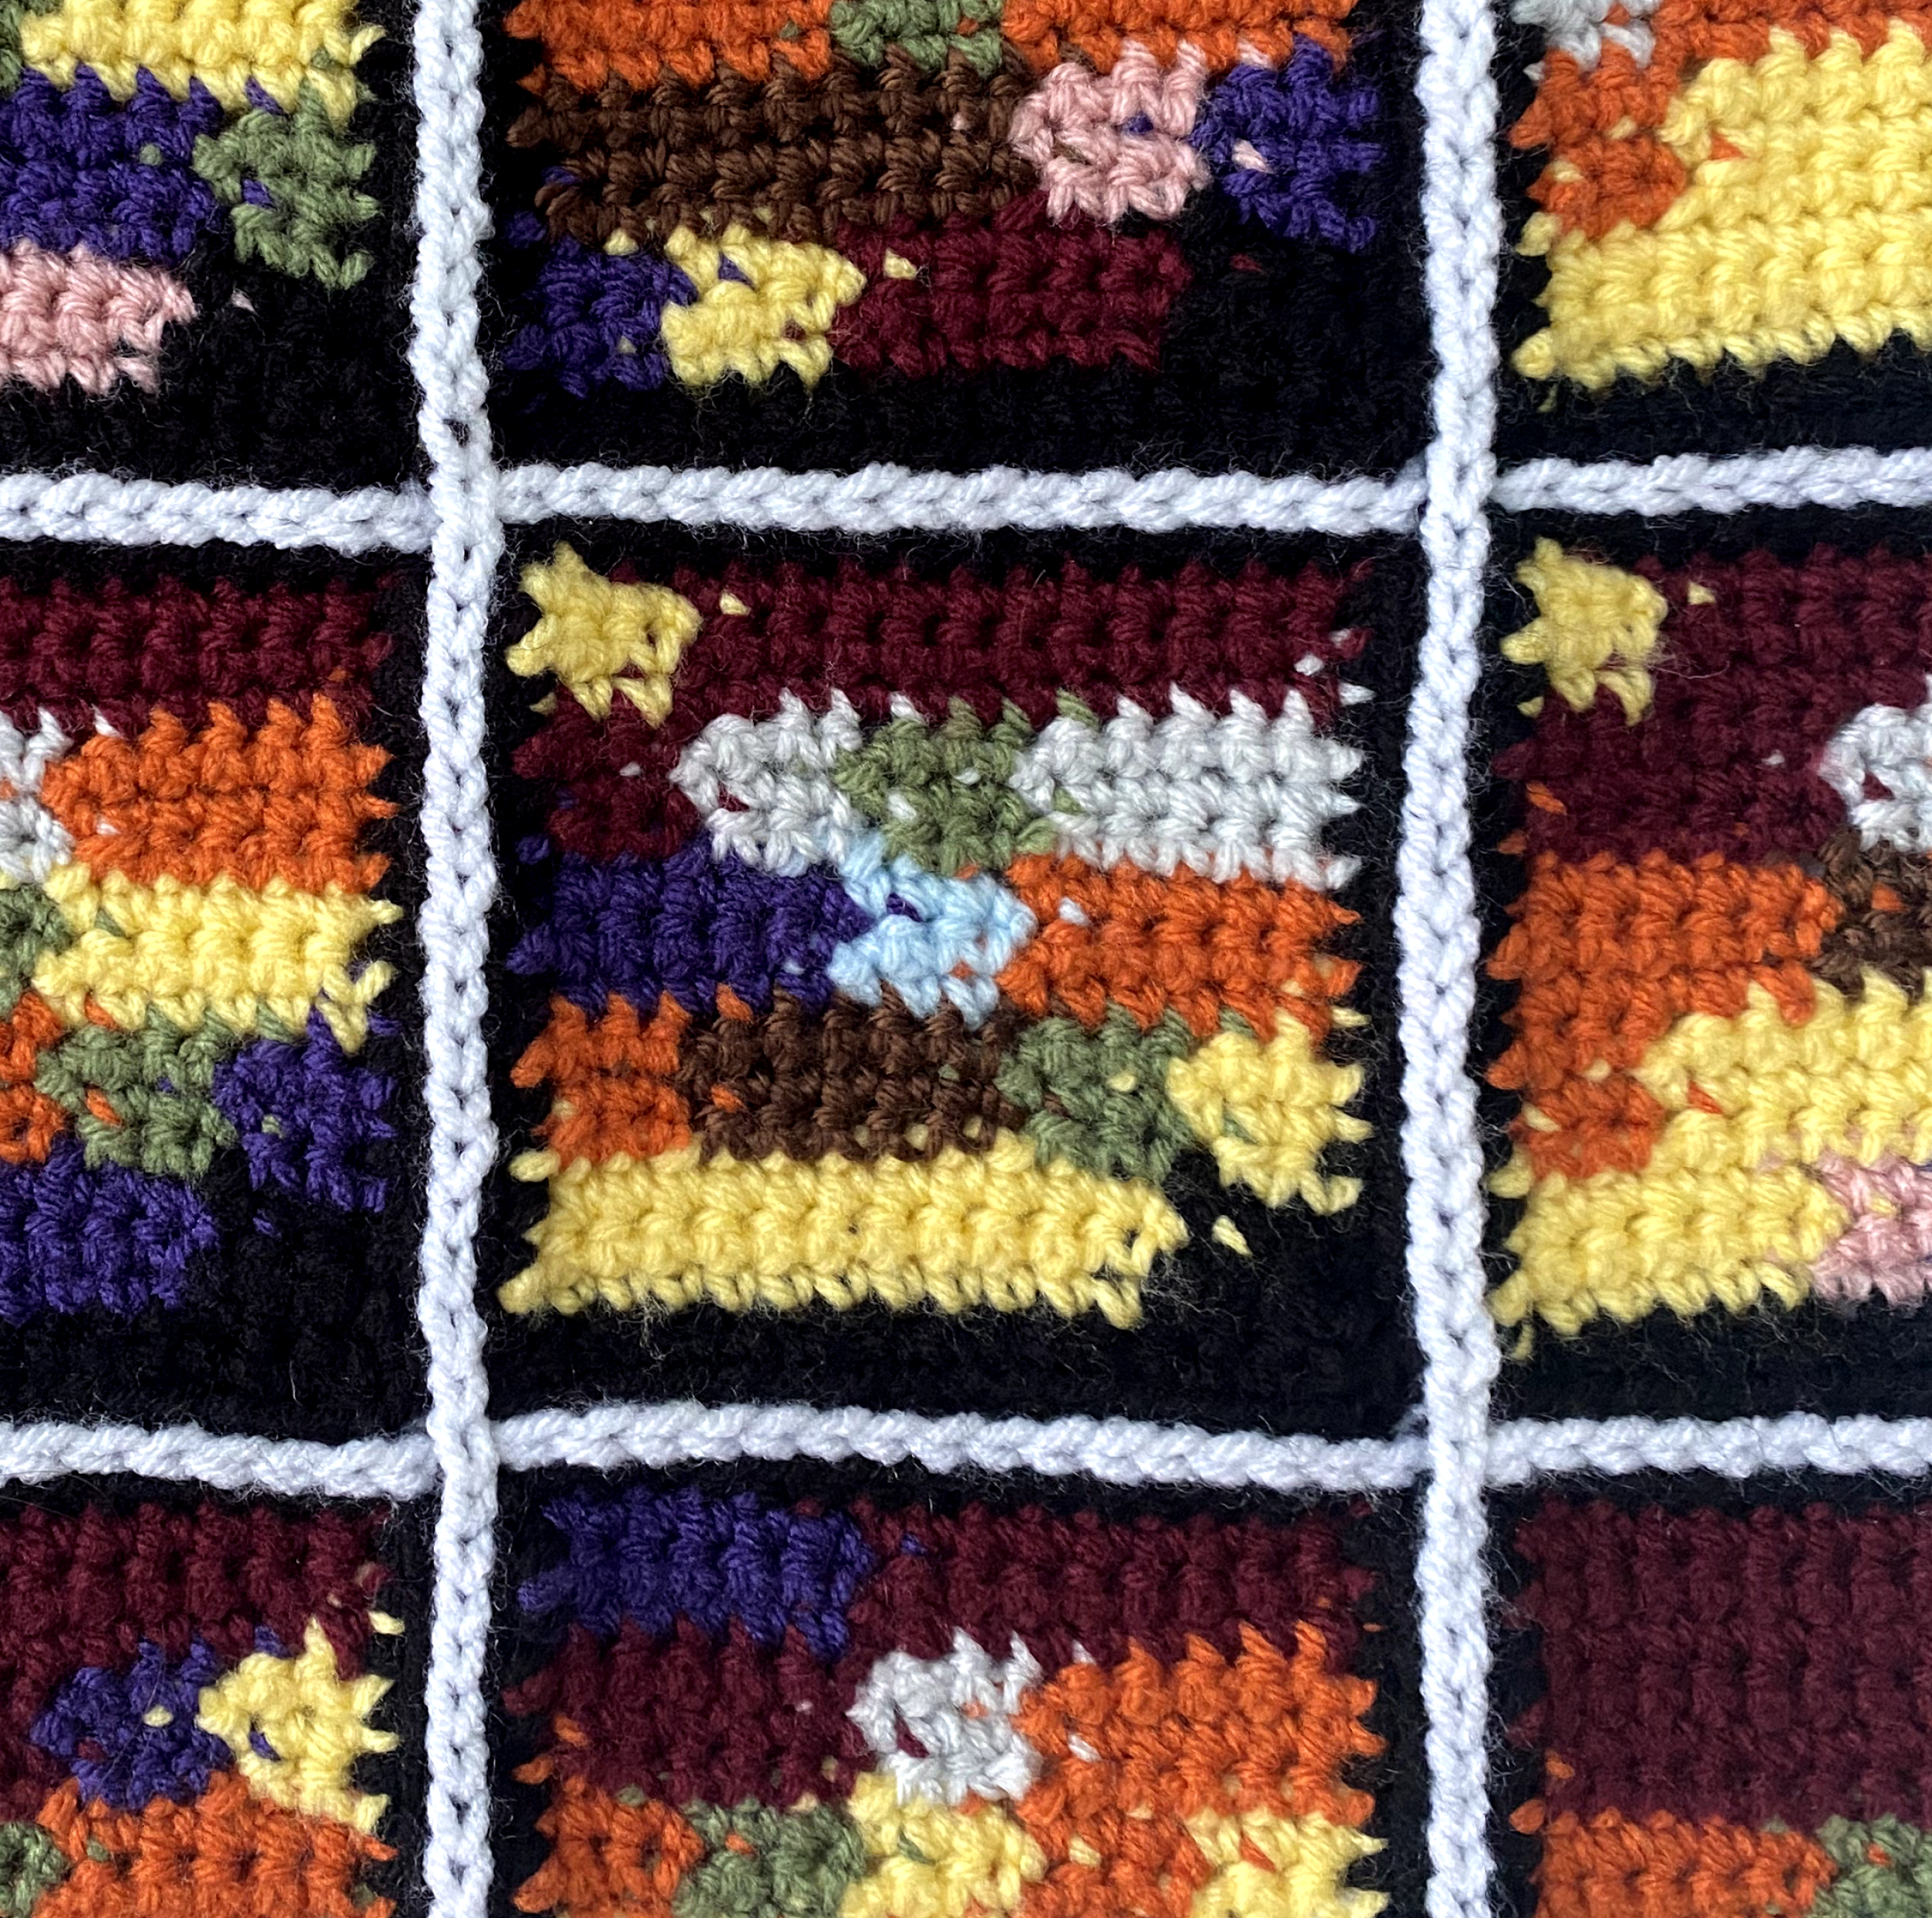
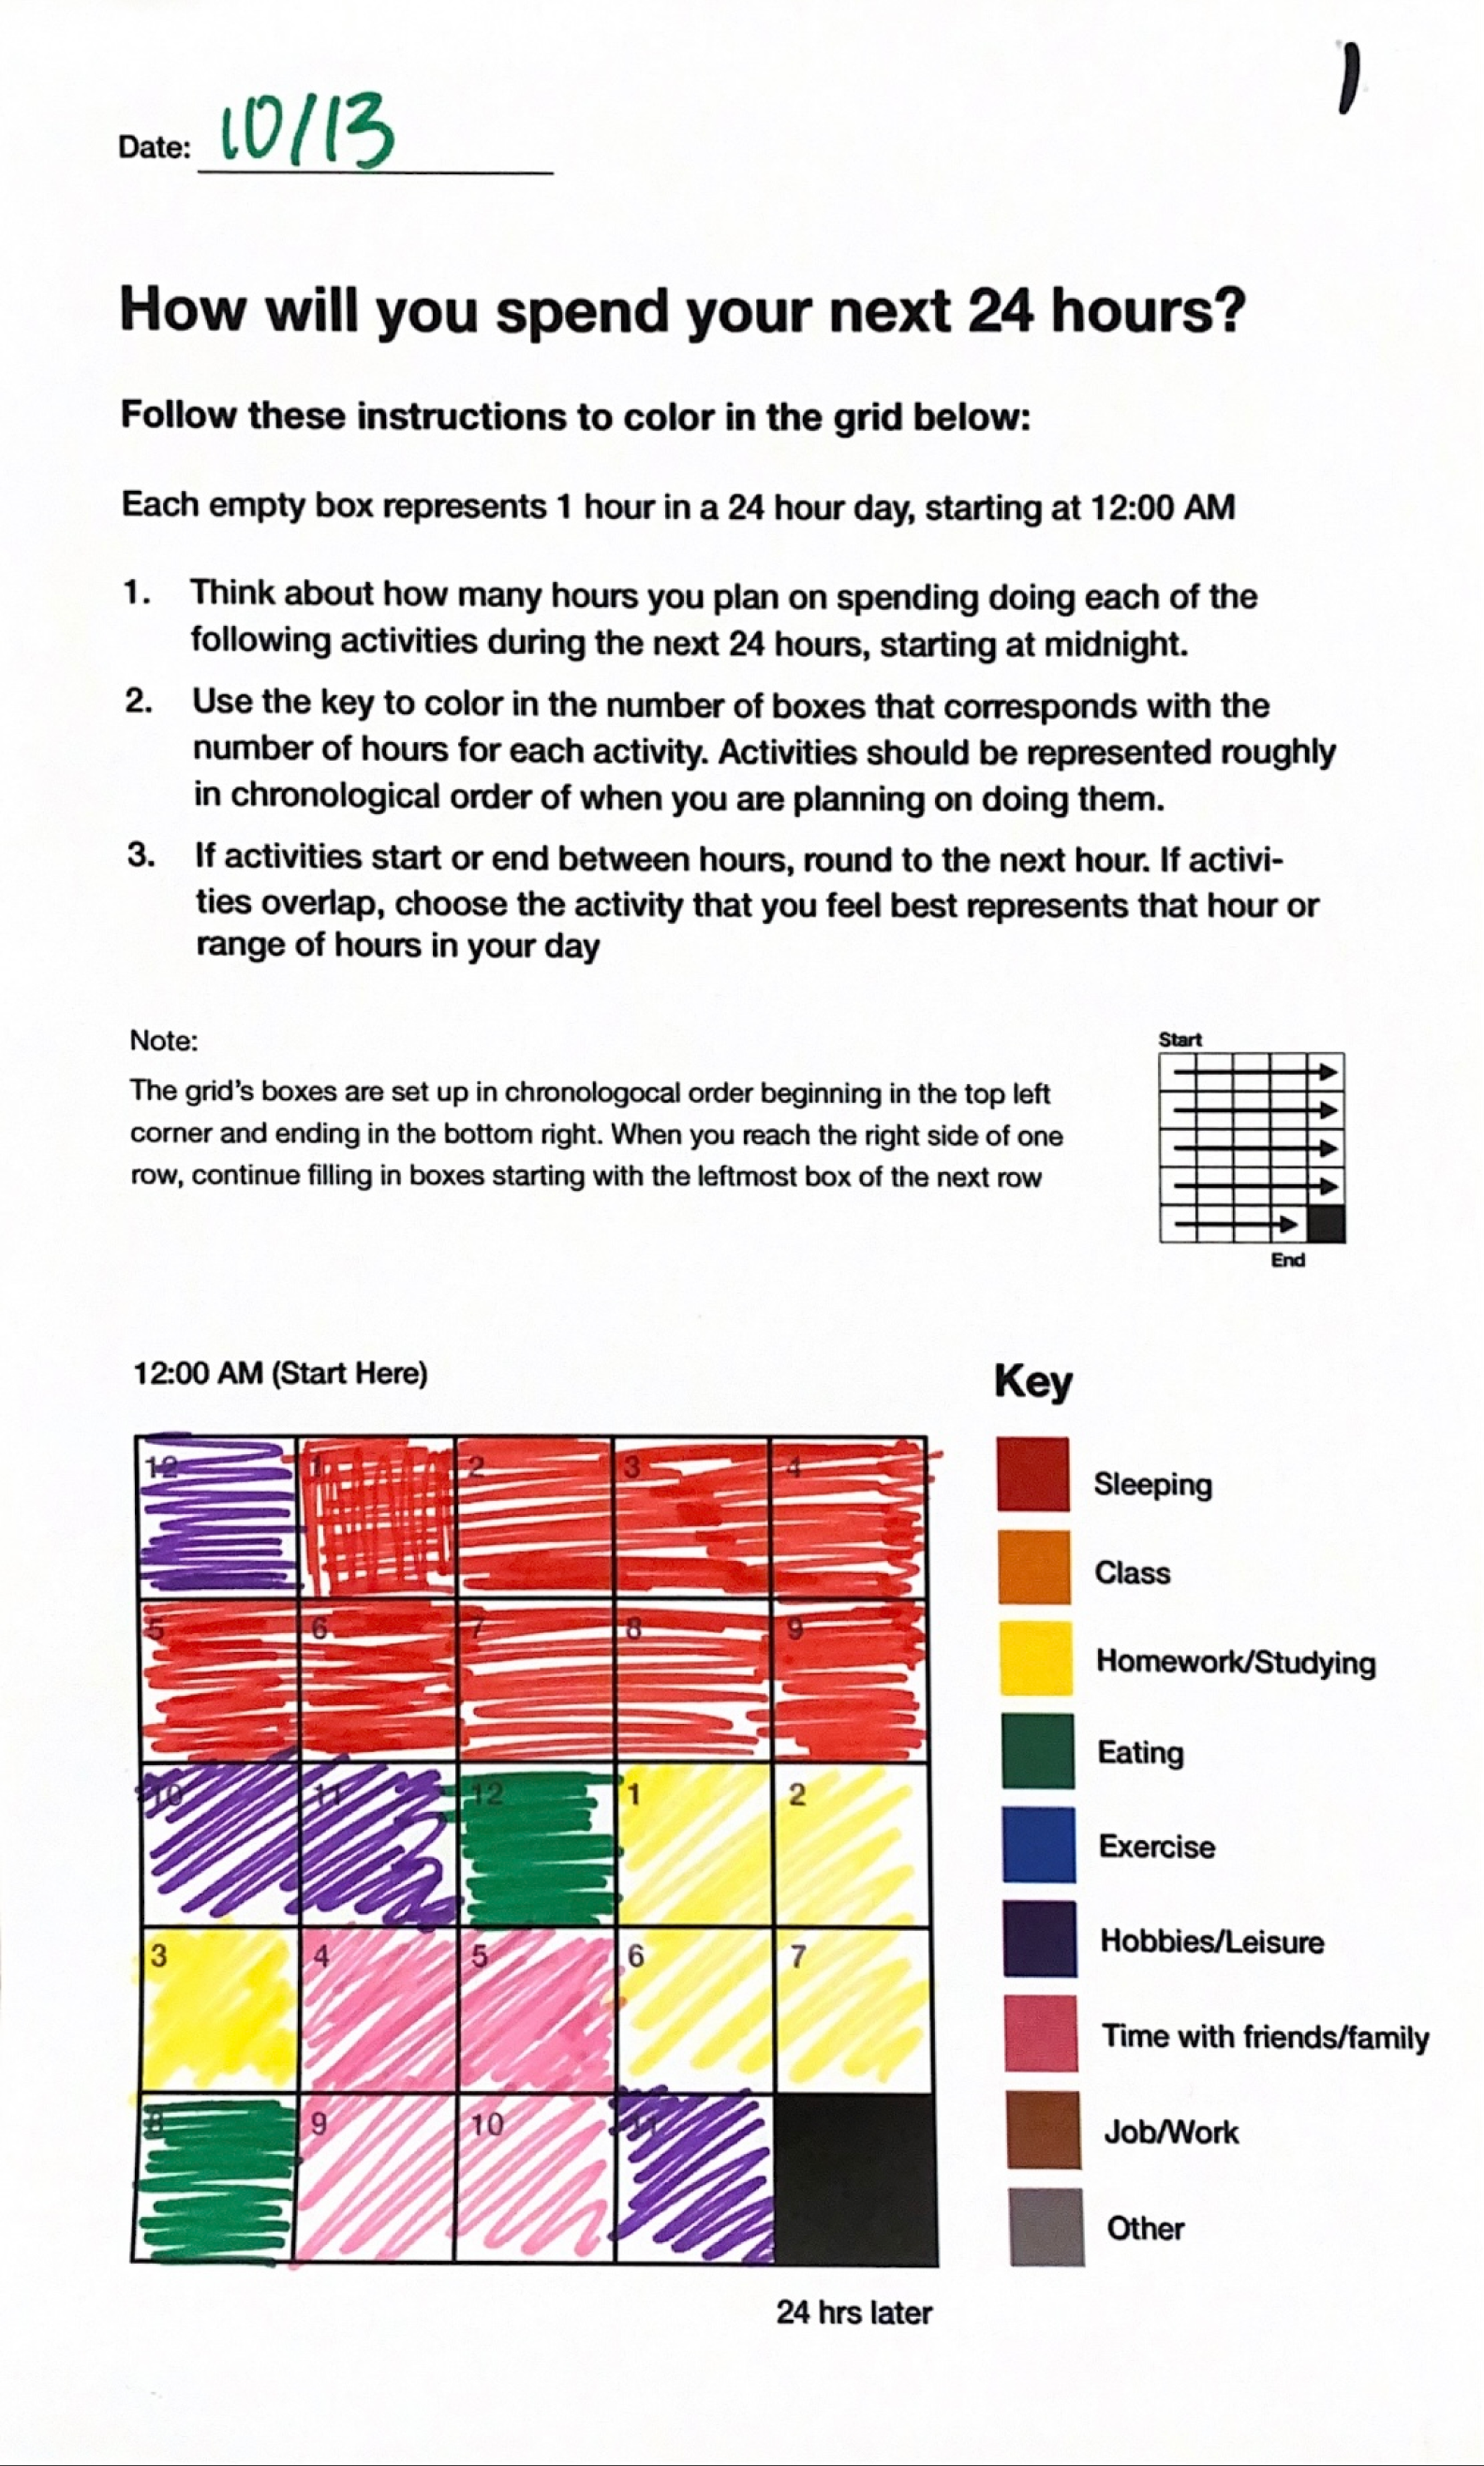
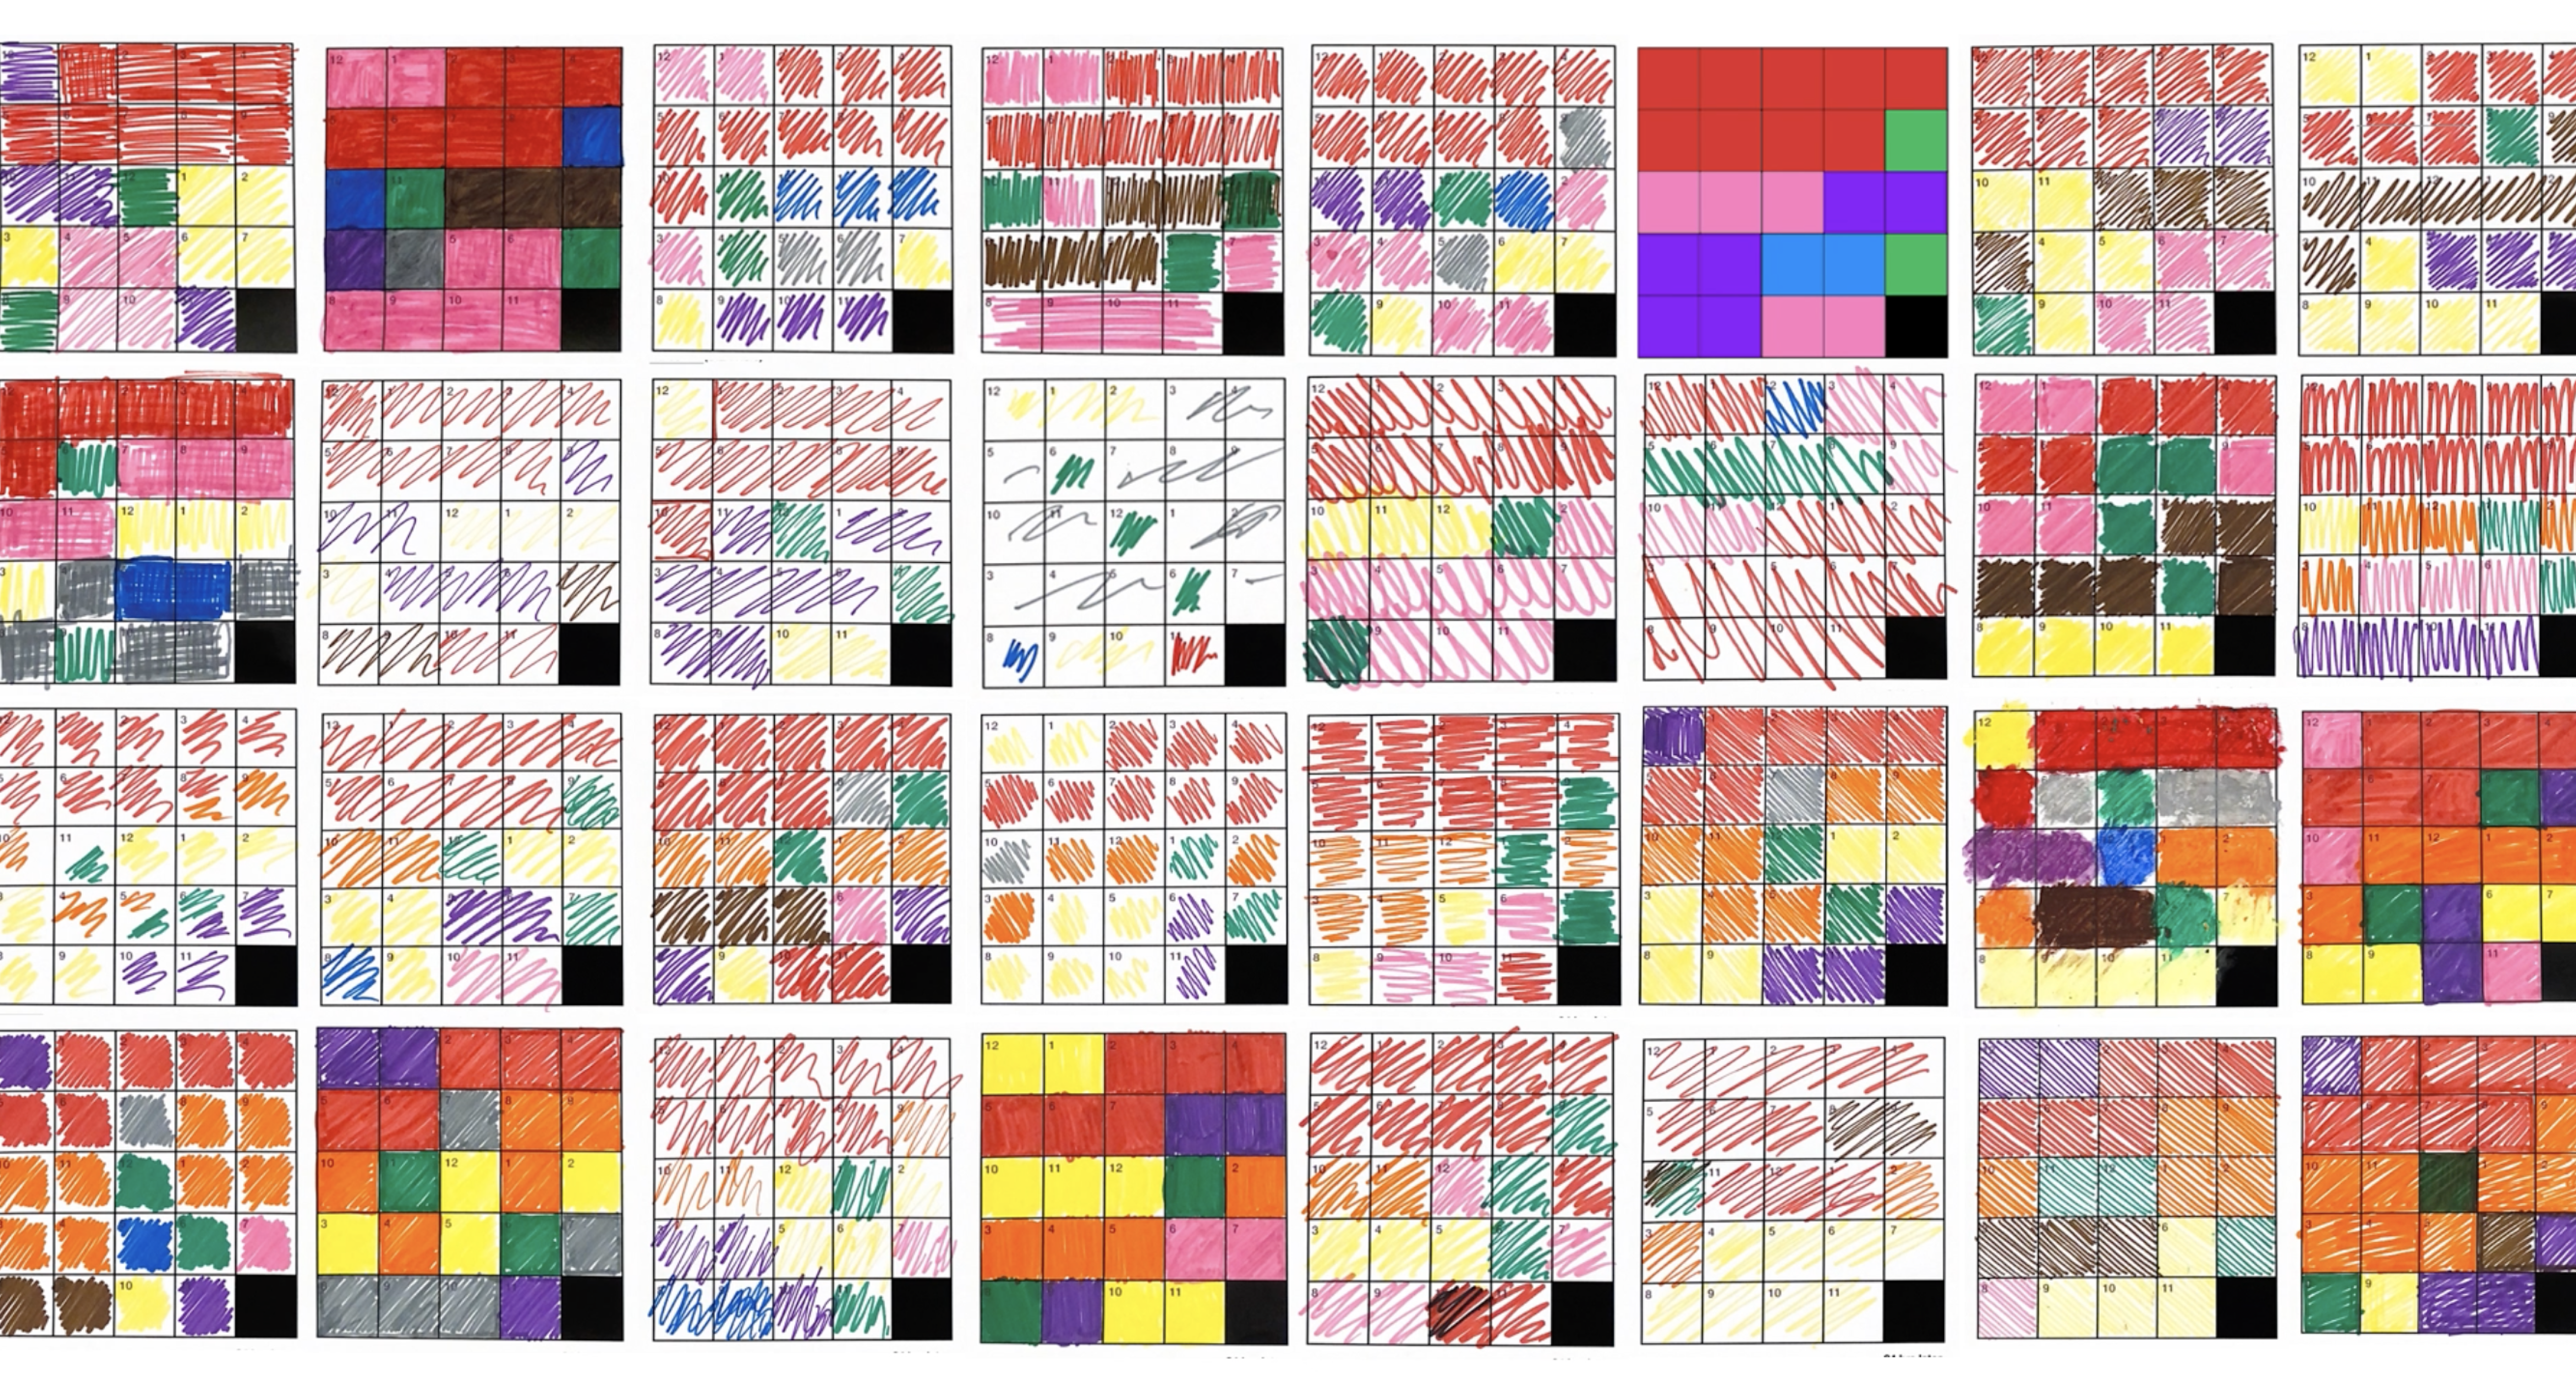
Each data point was collected by asking participants to fill out a 5x5 grid based on how they plan to spend their next 24 hours. Each cell in the grid represents one of the 24 hours, and each color in the key represents a different activity that one might encounter during a typical day. These included sleeping, attending class, doing homework or studying, eating, exercising, engaging in hobbies or leisure activities, spending time with friends and family, working, and other.
The data was collected over the course of one week and represented the various days in the life of university students and faculty. Each grid was then recreated as a crochet square and compiled into a blanket in chronological order of when each grid was completed.
When viewed in sequence, the final piece offers insight into the habits, obligations, priorities, and plans of those represented. Additionally, as an activity that communicates the participants’ predicted use of time, it brings into conversation the relationship between how we foresee spending our lives versus the reality of living them.
